This post is also available in:

A Canadian Success Story 50 Years in the Making
Housing co-operatives have played a vital role in building strong, inclusive communities across Canada. Rooted in shared values and democratic governance, co-ops offer more than just a place to live; they provide stability, belonging, democratic participation and long-term affordability.
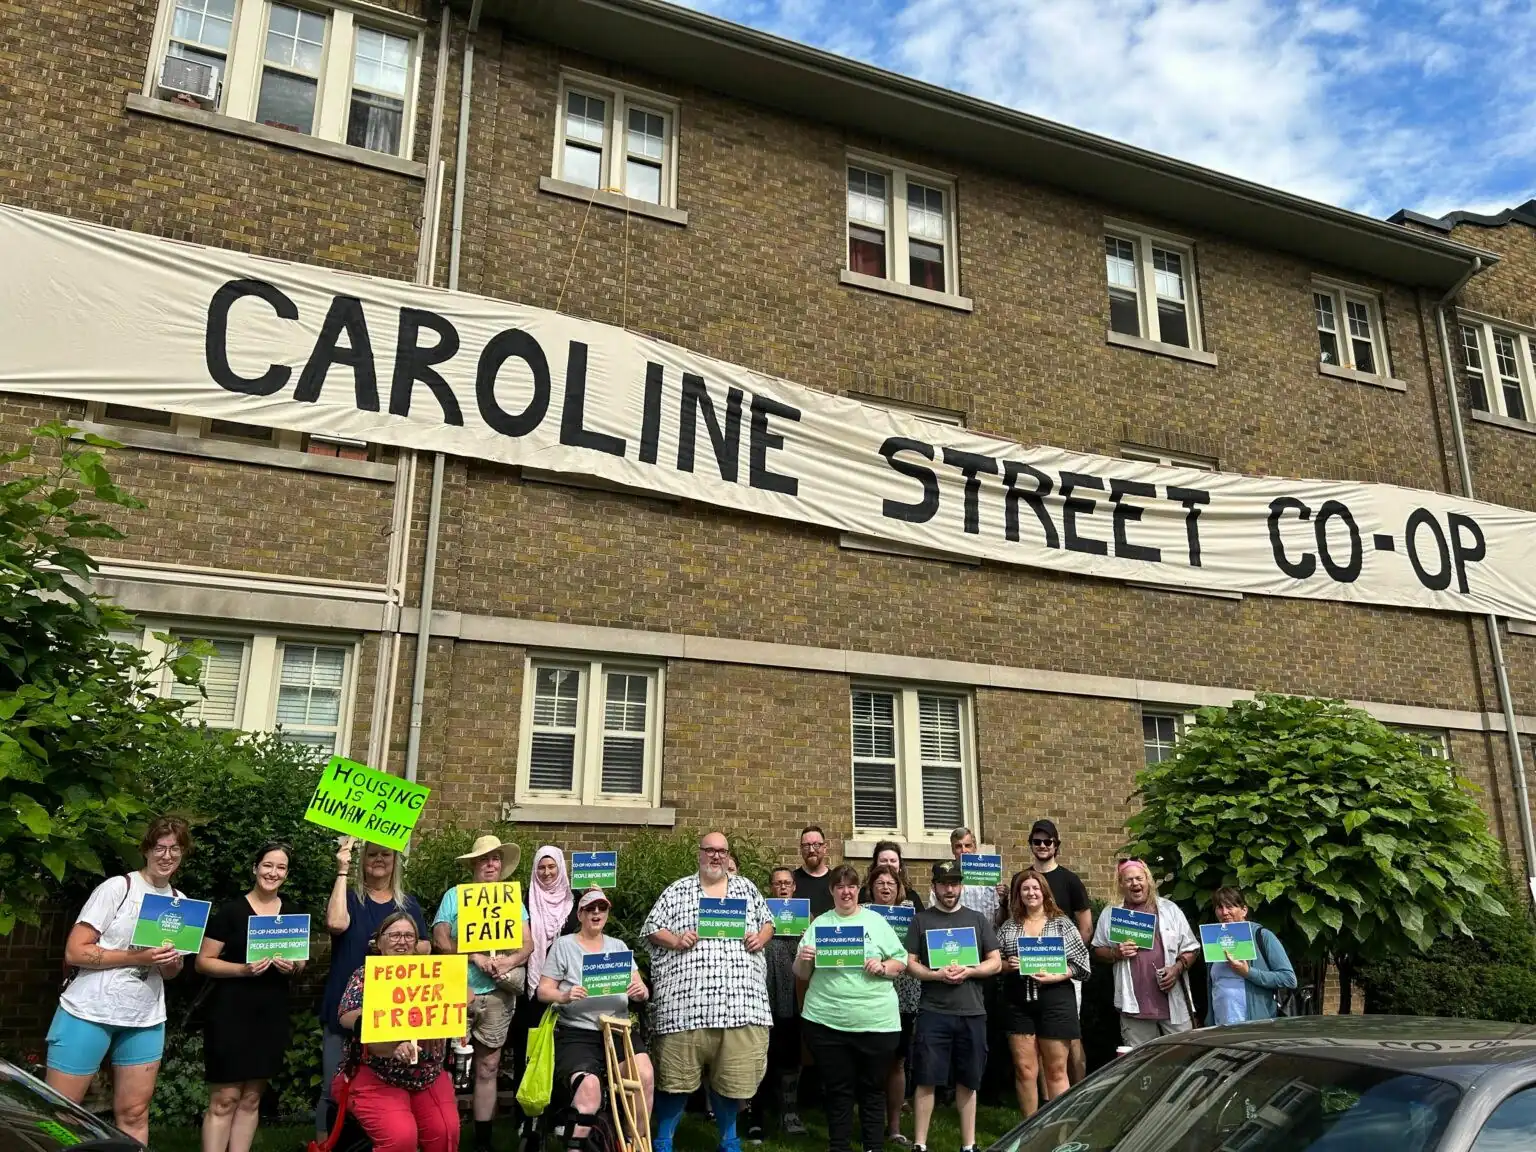
Community in Action: The Birth of Caroline Co-operative
In 2022, when the apartment building at 272 Caroline St. in Hamilton went up for sale, the tenants were concerned about renovations and rent hikes
But instead of becoming another casualty of the financialization of rental properties, they organized.
They created a tenants association, then pursued their dream of purchasing the property to make it into a housing co-op.
They garnered widespread support: from the City of Hamilton, to the Canada Mortgage and Housing Corporation. When outstanding repairs threatened a potential deal with the landlord, they held a rally. They learned hands-on how powerful they are when they act together, building local community support and using social and local media to gain attention.
Early on, they reached out to CHF Canada for support, through the process of founding the co-op and creating an Asset Management Plan to understand the priorities for caring for the property. The Golden Horseshoe Co-op Housing Federation also provided guidance throughout the process.
With no one single funding source available to help they reached far and wide to fundraise. They ended up with four financial partners, seven funding partners as well as anonymous donors. At their founding celebration, they thanked more than 80 folks who supported them along the way.
It’s a testament to their determination and hard work that they were finally able to make their dream a reality. As the sign out front now reads, “Caroline Co-operative, established in 2024, when the tenants took over.”
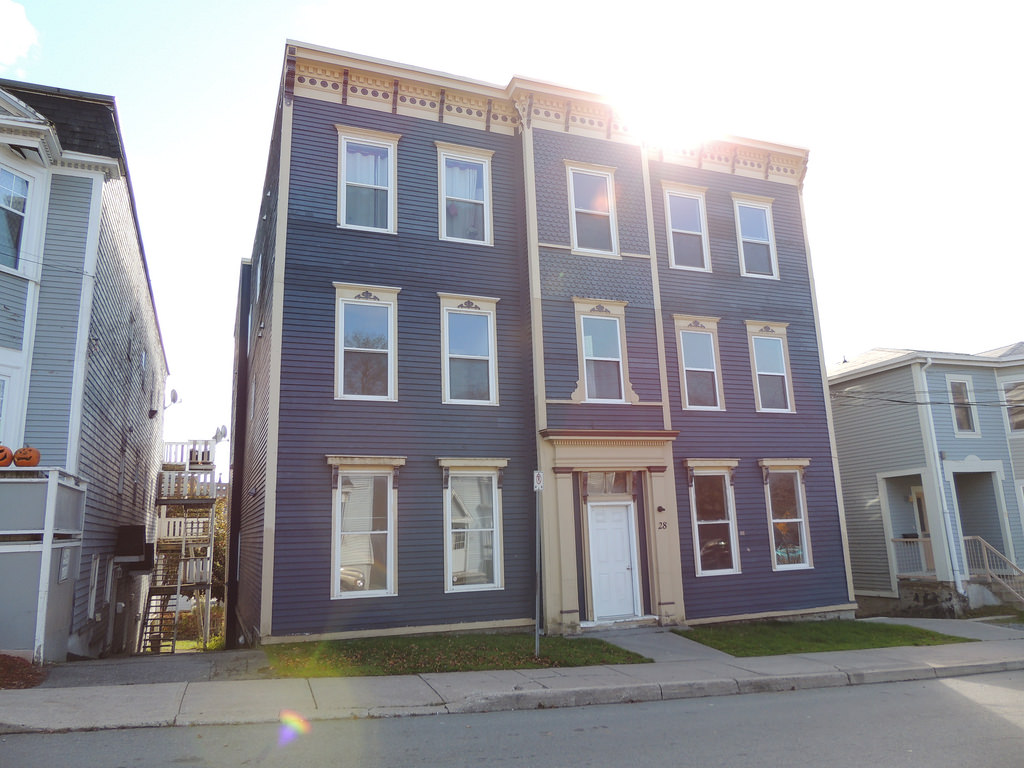
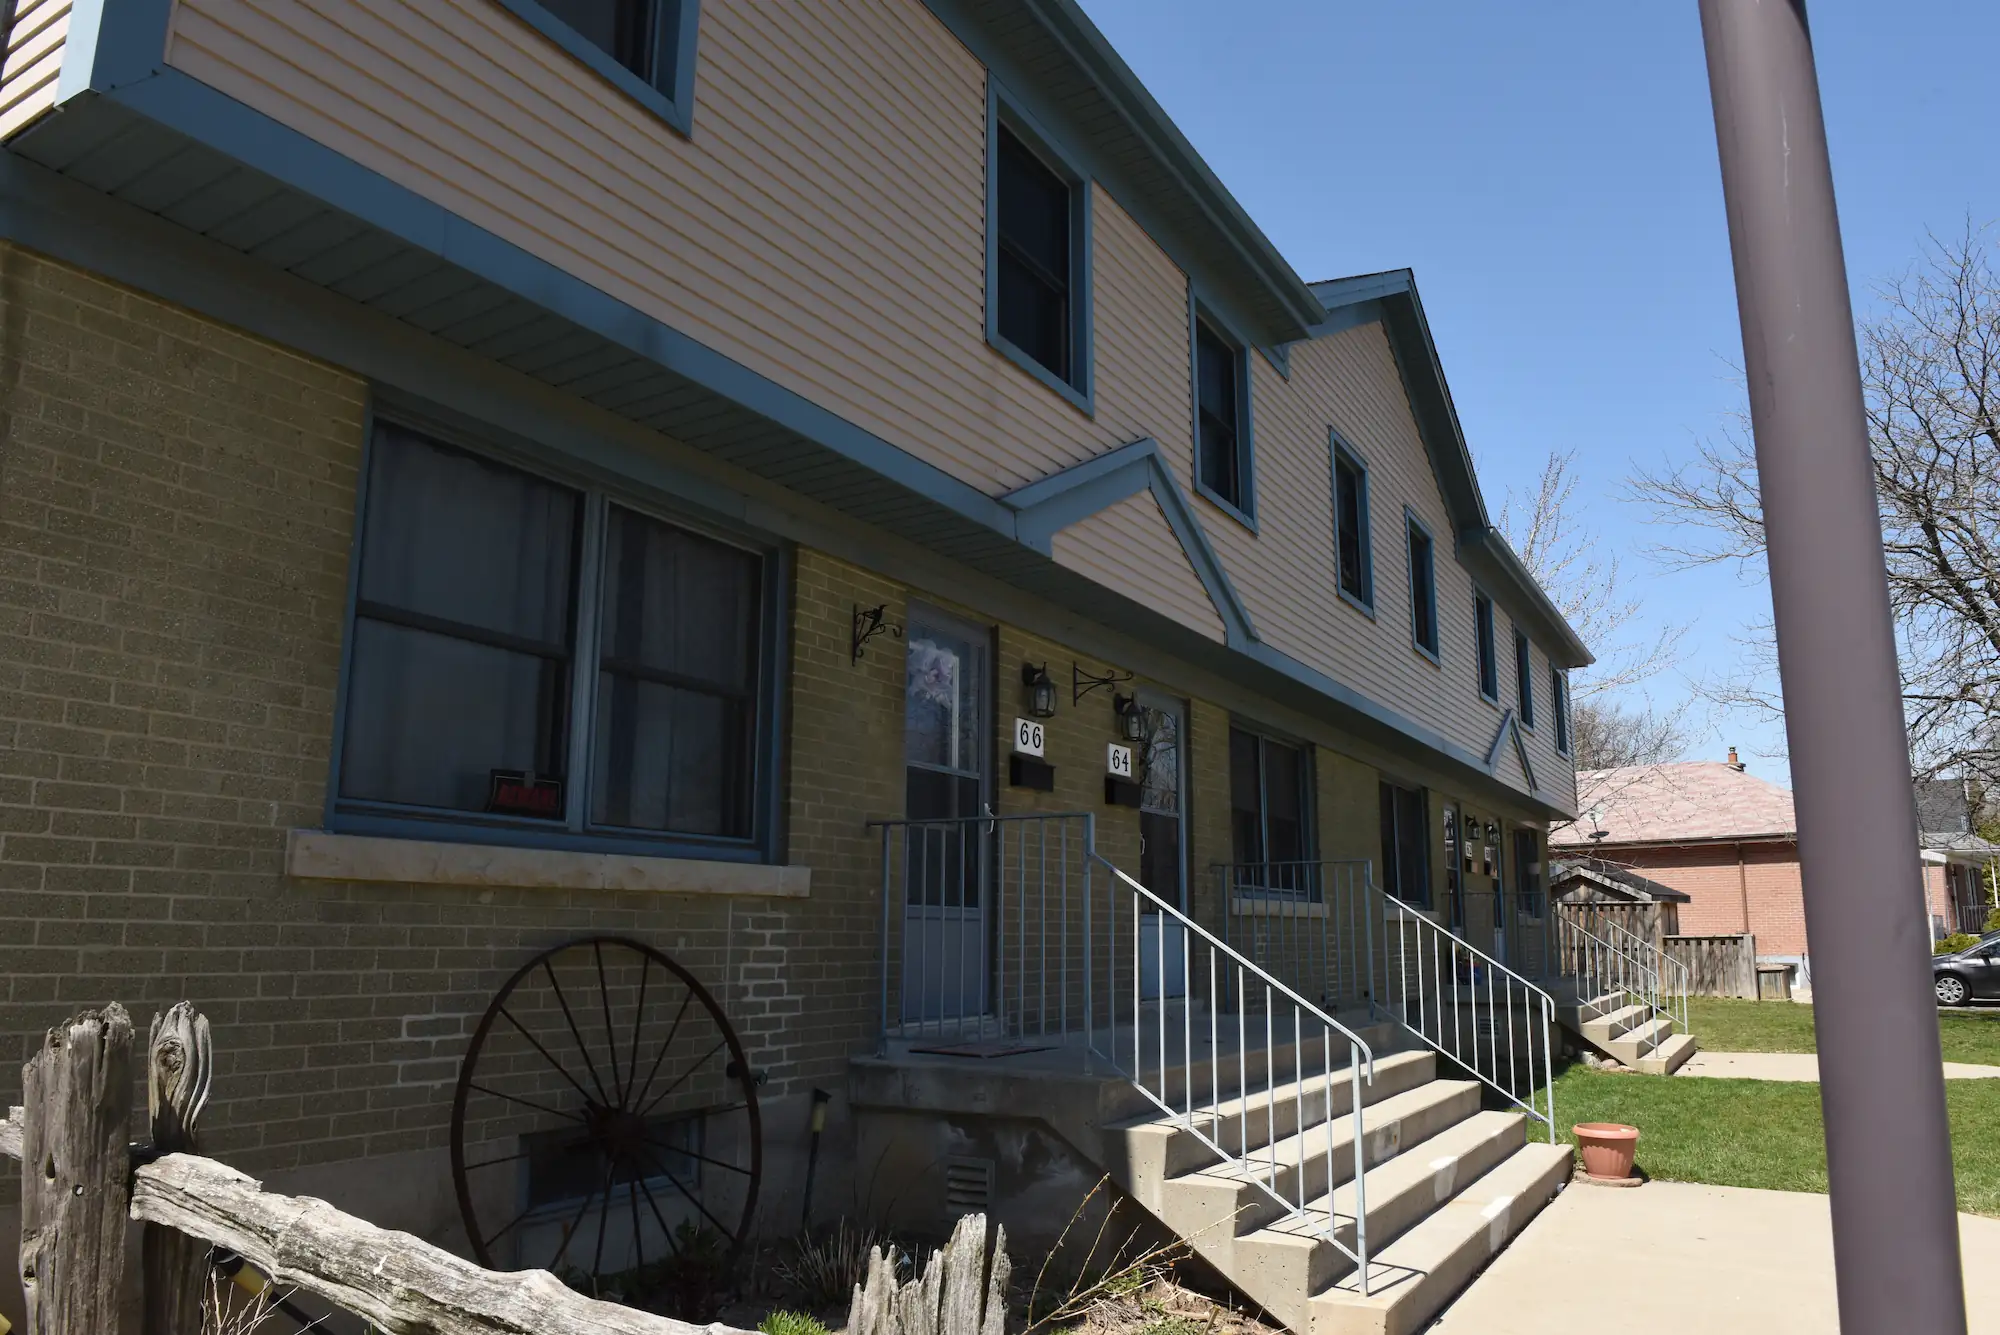
When Historic Displacement is Upended: Unity North Neighbourhood Welcomes its First Members
When Compass Nova Scotia had the opportunity to acquire a parking lot on which to develop new co-op homes, they did outreach to learn more about the community.
Using the local organization 902 Man Up, they led focus sessions to identify key needs of the community. Gentrification had started to creep into the North Halifax neighbourhood, squeezing out Indigenous and African Nova Scotians who had cultural and historical ties to the area.
To counter that, Unity North gave priority to Indigenous and African Nova Scotians who were living or had previously lived in the neighbourhood. New members moved into the 57 co-op homes in 2025. Their grand opening included balloons and bubbles for the children. With a shared courtyard and common spaces, they are busy building a new community with shared experiences and memories.
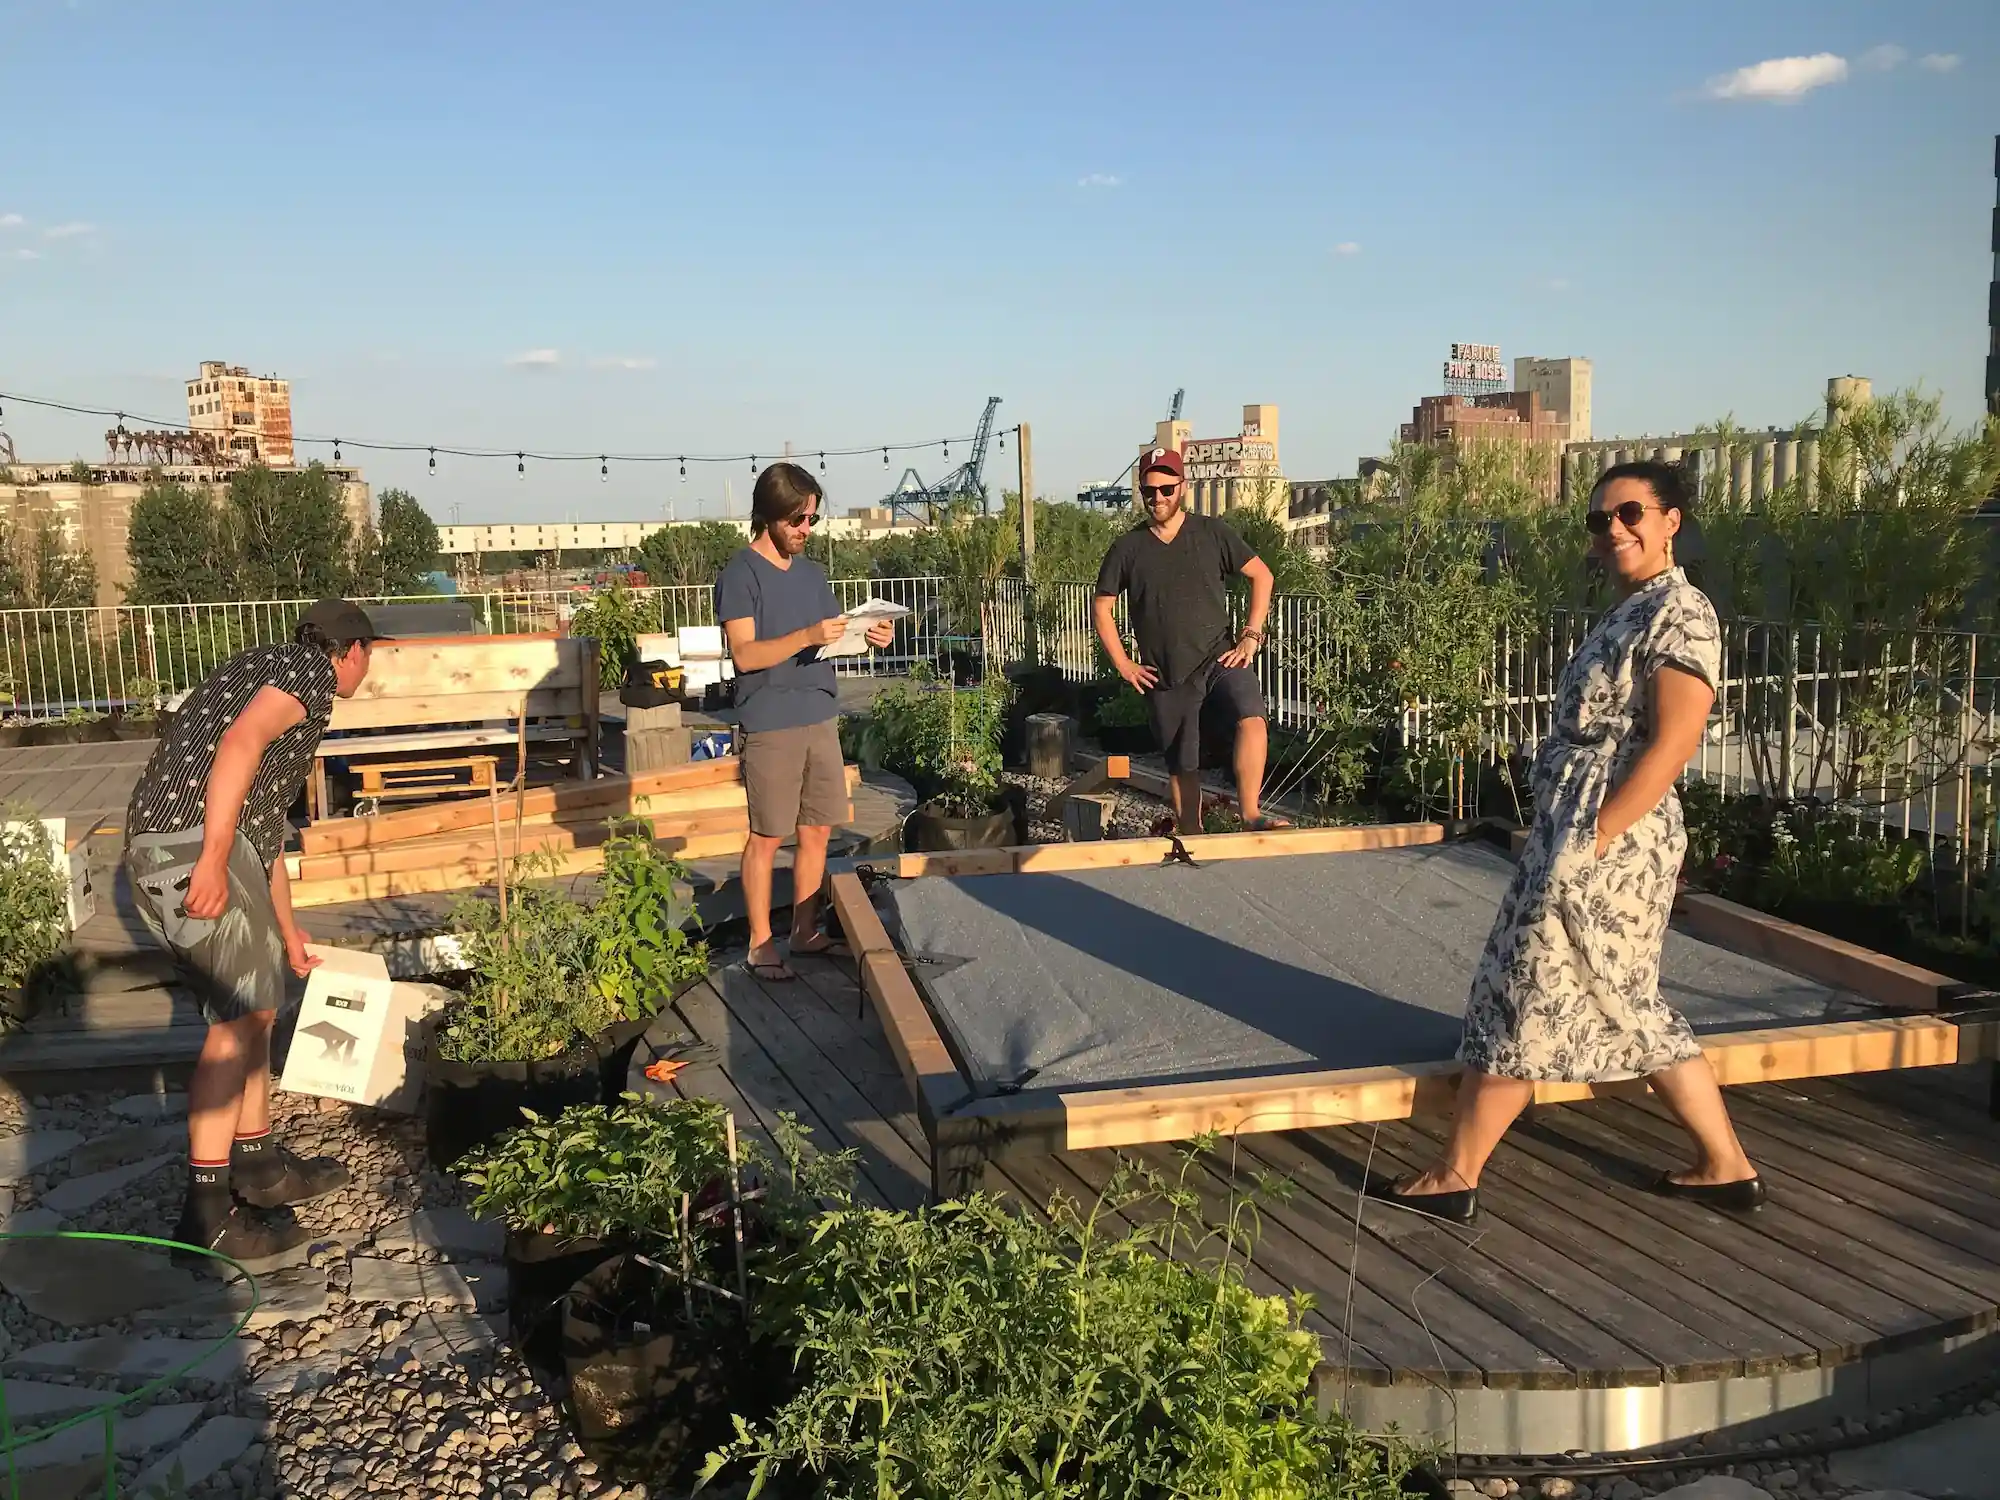
Rooted in Resilience: How Keegano Co-op is Greening for the Future
For members of Keegano Housing Co-operative in Edmonton, Alberta, a bad summer of drought and wildfires was a wake-up call to examine the use of their property.
They worked with an arborist to take down dead trees. They not only wanted to remove potential fuel in the event of a wildfire, but they wanted to update the garden so it could survive the climate changes in the region.
Keegano is one of the oldest housing co-ops in Edmonton, with 50 townhomes. The Garden Committee successfully got a grant from the Alberta Native Plant Council to rebuild a rock garden and plant native species that can better survive the more frequent drought conditions. They also applied for and got a CHF Canada microgrant to install 35 state-of-the-art rain barrels.
“It was such a meaningful project for us,” said Garden Committee member Gwendolyn Topliffe. “We are trying to preserve our shared green spaces from increasing drought and dry conditions by redirecting rain-water to the newly installed native plant beds.” Added fellow committee member Lynda Drew, “The uncertain future conditions could produce circumstances where these barrels take on an essential role in helping the co-op maintain the beautiful grounds that help define Keegano.”
Fortunately for their gardens, Mother Nature watered them that first summer. But the rain barrels will come in handy when drought conditions inevitably return. And the community of Keegano Co-op are ready to do their bit for water conservation.

Co-ops are Home to More Than a Quarter Million Canadians
Spanning every province and territory, these communities reflect the diversity and resilience of Canada itself.
Co-operative housing puts people first.
Members Work Together
They create safe, secure homes and vibrant neighbourhoods proving that when communities lead, lasting solutions for generations are possible.
Benefits of membershipNow more than ever, discover why co-op housing continues to grow, innovate, and deliver affordability where Canadians need it most.
Read the research